Frontend & Data Visualization Engineer
I design and build data-driven web experiences.
I build award-winning interactive web experiences across storytelling, data tools, and mapping—transforming complex data into clear, intuitive interfaces.
Recognized by


Selected Work
Featured Projects
Interactive data visualizations and storytelling experiences built with modern web technologies.
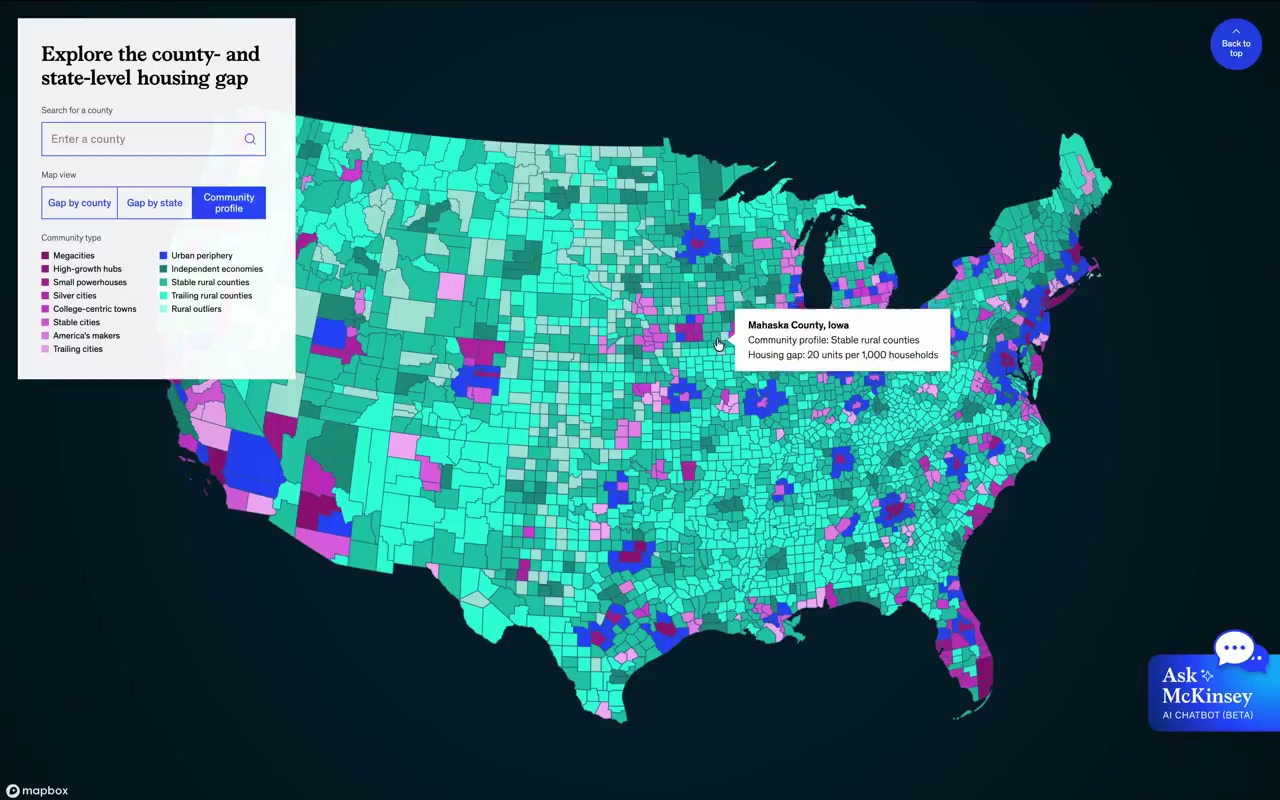
Mapping the US Affordable Housing Crisis
2025Interactive scrollytelling experience with immersive map-based storytelling about the US housing gap.
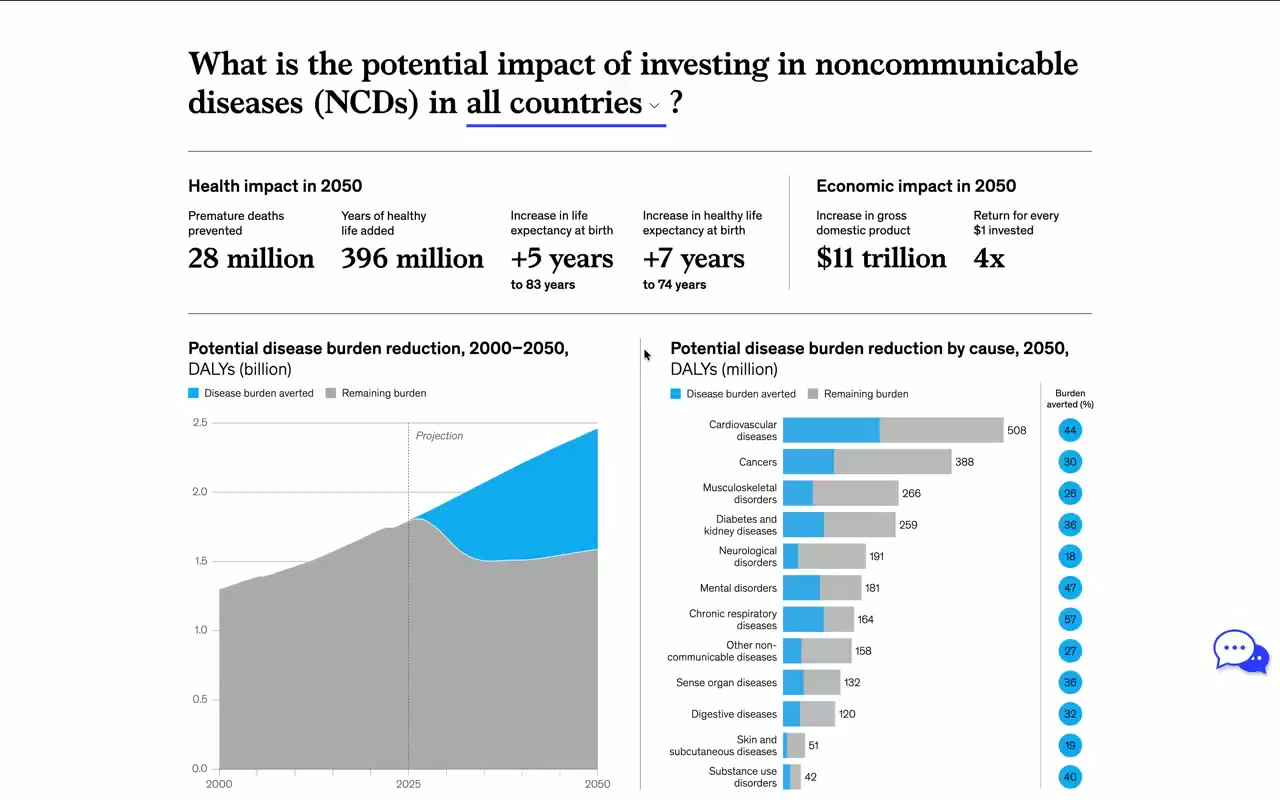
Investing in Addressing NCDs
2025Custom dashboard presenting country-level model estimates for disease burden reduction.
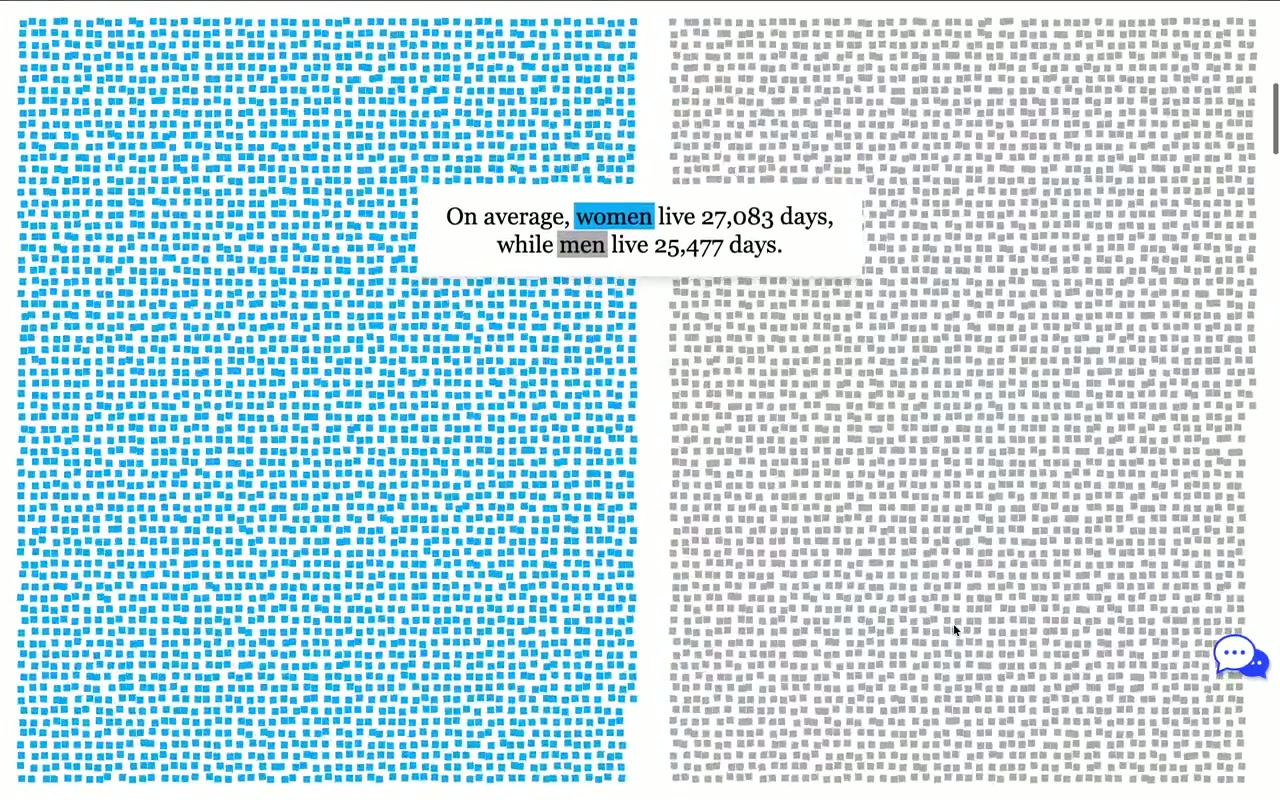
Women’s Health Gap — Scrollytelling Hero
2022Custom scrollytelling hero with multiple visual states and smooth transitions introducing the women’s health gap.
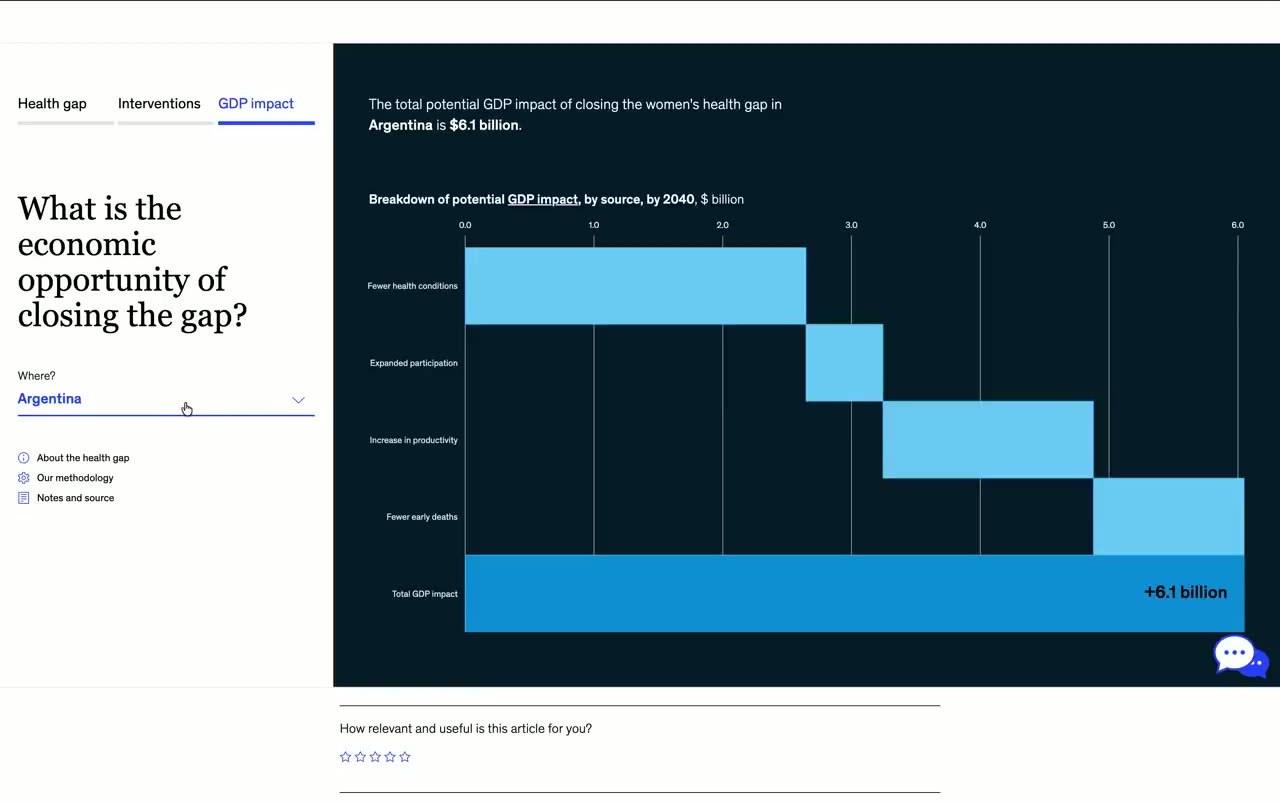
Women’s Health Gap — Interactive Dashboard
2022Interactive dashboard with multiple views, toggles, and dynamic contextual text exploring country-level data.
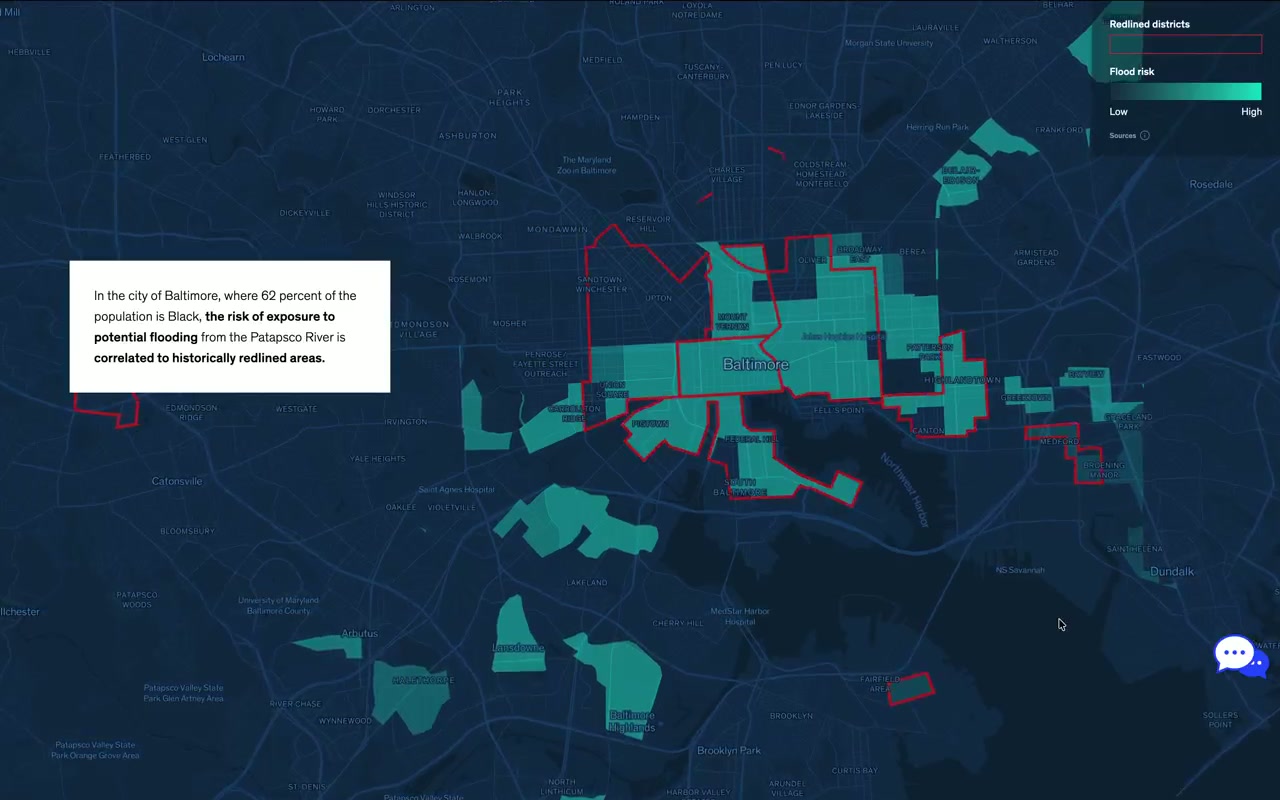
Impact of Climate Change on Black Populations
2022Scrollytelling experience featuring animated geospatial visualizations of climate impact disparities.
McKinsey Year in Review 2023
2023Multiple interactive experiences transforming static visualizations into dynamic storytelling components.
Expertise